In this article we will explore how to use mix composition to control the hardness or "scoopability" of ice cream or gelato. The serving temperature which influences the concentration of ice present will also be considered. The volume of air added during freezing (overrun), the manufacturing process and the concentration and type of emulsifier can also affect hardness.
However, these effects are generally less significant than the concentration of sweeteners used and serving temperature. This article should be read in conjunction with the article on the sweetness of ice cream.
This article originally had the title "Goldilock's ice cream. Controlling hardness or scoopability." Goldilocks was a character from "Goldilocks and the Three Bears" a British 19th-century fairy tale and I originally thought that everyone would understand if an ice cream was acceptable to Goldilocks it had to be good! I have changed the title to reflect that many readers have not read this fairy tale and I may have been inadvertently confusing people.
There is an extensive range of flavoured ice creams (Plate 1) however there is frequently a marked difference in hardness between
flavours, e.g. the chocolate flavour is often harder, more difficult to scoop, than the vanilla or strawberry flavours.
While it is unclear how much the consumer in the UK, or the US, is concerned with differences in hardness between flavours, and batches of flavours, gelato enthusiasts are and demand gelato of consistent and similar hardness regardless of flavour.

Plate 1. Range of flavoured gelato in a retail display cabinet in Naples, Italy.
In recent years there has been a significant increase in the number of specialist ice cream shops / parlours or gelateria. Many of these gelateria owners, particularly in continental Europe, require ice cream or gelato that is of consistent sweetness and resistance to scooping, also called dipping in the U.S., or more simply hardness. Consequently food technologists should have a good understanding of how to formulate an ice cream mix to control the hardness and sweetness of the ice cream.
Freezing point depression
Pure water at standard pressure (101.325 kPa) freezes at 0°C. Addition of sugar e.g. sucrose will lower the temperature at which the water freezes; the freezing point depression (FPD).
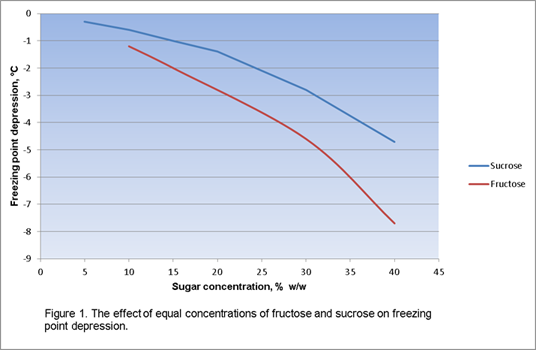
The FPD of an ice cream mix depends mainly on the number of sweetener molecules in the mix recipe and the number of milk salt ions. The number of molecules depends on the weight of the sweetener added and its molecular or formula weight. This effect can be illustrated using two common sugars, fructose and sucrose. Fructose has a molecular weight of approximately 180 whereas sucrose has a molecular weight of about 342. The FPD of a 1% fructose solution is approximately twice that of a similar sucrose solution because there is almost twice as many molecules of fructose present in the fructose solution; fructose has about half the formula weight of sucrose. This effect is shown in figure 1 and is derived theoretically in examples 1 and 2.
The effect of a solute e.g. glucose on the freezing point depression of a solvent e.g. water can be calculated in dilute solutions using equation 1.
Equation 1. ΔTf = iKfm
Where ΔTf is the freezing point depression, i is the van't Hoff Factor, Kf is the molal freezing-point depression constant (this is solute specific) and m is the molar concentration of the solute. The units for Kf are °C m-1and the Kf value for water is 1.86 °C m-1. The van't Hoff Factor is determined from the number of ions in the molecular formula of an ionic compound. Since carbohydrate-sweeteners are not ionic compounds the van't Hoff Factor will not be considered further and is removed from the equations in the examples below.
We will now illustrate the use of equation 1 by calculating the theoretical freezing point depressions of 1% (w/w) solutions of glucose (Example 1) and sucrose (Example 2) in water.
|
Example 1. Calculate the FPD of a 1% w/w solution of glucose in water. Given: glucose has a molecular weight of 180.16 and water has a Kf of 1.86 °C m-1. Calculate the moles of glucose present in 1 kg of water. Equation 1 is then used to calculate ΔTf . Moles of glucose =10 = 0.0555 moles ΔTf = 0.0555 x 1.86 Freezing point depression = - 0.103°C. |
|
Example 2. Calculate the FPD of a 1% w/w solution of sucrose in water. Given: sucrose has a molecular weight of 342.29 and water has a Kf of 1.86 °C m-1. Calculate the moles of sucrose present in 1 kg of water. Equation 1 is then used to calculate ΔTf . ΔTf = 0.0292 x 1.86 Freezing point depression = - 0.054°C. |
The calculations above show that the monosaccharide glucose depresses the freezing point of water by almost twice the disaccharide sucrose. This effect explains why monosaccharide’s e.g. glucose and fructose depress freezing point more than disaccharides such as lactose and sucrose. Pentose’s such as xylitol depress the freezing point even further.
This effect, the greater the number of molecules of sweetener then the lower the FPD, is known as a colligative effect and is independent of the chemical nature of the solute.
The FPD of an ice cream mix, and the hardness of the final ice cream, can be controlled by varying the concentration of sweetener or sweeteners added. As the sucrose concentration is increased softer ice cream will be produced. However the ice cream may become too sweet prior to the desirable softness being obtained. Alternatively part of the sucrose can be replaced with a less sweet sugar e.g. glucose, which has approximately twice the FPD of sucrose. Another option might be to use fructose that has an identical FPD to glucose (both sugars have the same formula weight) but is much sweeter than sucrose along with glucose syrup and reduce the concentration of sucrose used.
The freezing point depression factor
Food scientists and technologists can calculate the theoretical freezing point depression or determine the actual freezing point of ice cream mixes and construct freezing curves. These can be used to calculate the concentration of ice and unfrozen water in ice cream at particular serving temperatures and are very useful in product development. This topic will be discussed later. However, this approach is not widely used outside the larger companies that have good research and development facilities. Instead, methods based on the calculation of the freezing point depression factor (FPDF) of individual sweeteners in mixes are more widely used.
These calculations are based on summing the freezing point depression factor (FPDF) of each sweetener (lactose is not usually included in the US, UK and Ireland) used in the ice cream mix to give a total value that is then used for control purposes. Note lactose is included in the calculation of FPDF in continental Europe where the calculation is called Potere Anti Congelante, PAC. FPDF is not the same as the FPD which was mentioned previously and is a dimensionless number.
Ice cream manufacturers calculate the FPDF of a sweetener compared with an equivalent concentration of sucrose. Sucrose is used as a standard and allocated a value of 1. The FPDF of other sweeteners is obtained by dividing their formula weight into the formula weight of sucrose. The FPDF for a range of sweeteners is shown in Table 1. Note, manufacturers’ mean molecular weight data for syrups and maltodextrins should be used if available.
Table 1. The relative freezing point depression factor (FPDF) of selected sweeteners, sodium chloride and ethanol.
|
Sweetener |
Approximate molecular (or mean molecular) weight |
Freezing point depression factor* |
|
Sucrose |
342 |
1.0 |
| Salt** (sodium chloride) | 58.4 | 5.9 |
|
Alcohol** (ethanol) |
46 |
7.4 |
|
Dextrose |
180 |
1.9 |
|
Fructose |
180 |
1.9 |
|
Glucose Syrup 62 DE*** |
296 |
1.15 |
|
Glucose Syrup 42 DE*** |
429 |
0.8 |
|
Glucose Syrup 36 DE*** |
543 |
0.64 |
|
Glucose Syrup 28 DE*** |
643 |
0.5 |
|
Glycerol |
92 |
3.7 |
|
HFCS (42% fructose) *** |
1.76 |
|
|
HFCS (55% fructose)*** |
1.78 |
|
|
HFCS (90% fructose)*** |
1.78 |
|
|
Invert sugar |
190 |
1.9 |
|
Lactose |
342 |
1.0 |
|
Litesse® Polydextrose |
570 |
0.6 |
|
Maltose |
342 |
1.0 |
|
Maltose Syrup – 70%*** maltose |
380 |
0.9 |
|
Maltodextrin 18 DE**** |
1000 |
0.34 |
|
Maltodextrin 15 DE**** |
1200 |
0.29 |
|
Maltodextrin 10 DE**** |
1800 |
0.19 |
|
Maltodextrin 5 DE**** |
3600 |
0.10 |
|
Oligofructose |
0.5 |
|
|
Sorbitol |
182 |
1.9 |
|
Trehalose |
342 |
1.0 |
|
Xylitol |
152 |
2.2 |
|
Erythritol1 |
122.12 |
2.8 |
Notes
* Calculated by dividing the molecular weight of the sweetener into the molecular weight of sucrose. ** Salt and ethanol are included for comparative purposes. From: *** Smith and Bradley (1983); **** Hull (2010).
1 While this polyol has certain advantages as a partial replacer for sucrose it has a tendency to crystallise and its use can result in very hard ice cream or gelato. Erythritol crystallises in ice cream and gelato at around 8% w/w. Once 8% is exceeded regardless of its freezing point depression effect, ice cream becomes harder. Because of this it must be used in combination with other sweeteners.
Calculation of the freezing point depression factor
Calculations illustrating how to determine the FPDF of sweeteners are shown in Examples 3 and 4 below.
|
Example 3. Calculate the FPDF of sorbitol. The FPD of sorbitol is 342 = 1.9 This means that a solution of sorbitol depresses the freezing point by about twice as much as a similar solution of sucrose. Sorbitol is about 60% as sweet as sucrose. |
|
Example 4. Calculate the FPDF of a 28 DE glucose syrup given that it has an average formula weight of 643. This means that a 10% solution of a 28 DE glucose syrup depresses the freezing point by about half as much as a 10% solution of sucrose. In real life this means that a 28 DE glucose syrup has only a small effect of FPD. |
Further examples are provided in a very useful book on glucose syrups by Hull (2010).
Calculation of the FPDF of commercial ice cream mixes and its use in the control of hardness of ice cream (lactose not included)
Examples of FPDF calculations used to predict the hardness of ice cream are illustrated below.
These calculations are performed by tabulating the sweeteners present in 100 g of mix, the weight of sweetener added, their FPDF from table 1 and the total FPDF of each sweetener (product of the FPDF of the sweetener and the weight added). The total FPDF of each sugar is summed to give a total FPDF value for the mix (tables 2 and 3). Lactose is supplied by the the milk solids not fat (MSNF) components and is generally excluded from calculations outside mainland Europe. The justification for doing so is that the concentration of MSNF is generally constant between mixes (and is usually outside the manufacturer’s control). On the other hand, the major variables affecting FPDF are the added sweeteners; these are controlled by the product developer and are included in the calculation. However, there are occasions when the lactose concentration must be considered and there is a case for routinely including it in FPDF calculations.
The mix in table 2 has a FPDF of 15. Apart from sucrose, no other sugars have been added. Note it is also advisable to calculate relative sweetness when undertaking these calculations. A mix with a FPDF of 15 will give a hard ice cream the sort of ice cream called ‘brick’ ice cream in the UK and Ireland. This brick ice cream is typically cut into slices and made into ‘sliders’ in Ireland or eaten after being scooped (with a little difficulty- the scoop is often ‘warmed’) from domestic freezers, operating at around -18 °C, into dishes. Note scooping hard ice cream can result in wrist and other injuries with the potential for industrial injury claims (Dempsey et al., 2000).
|
Table 2. Determining the total FPDF of an ice cream mix containing added sucrose |
||||
|
Sweetener |
Weight, g |
FPDF |
Total FPDF of sweetener |
Relative sweetness |
|
Sucrose |
15 |
1 |
15 |
15 |
|
Total FPDF or relative sweetness of mix |
15 |
15 |
||
The mix shown in table 3 has a FPDF of about 25 and a similar relative sweetness to the previous mix. A mix with this FPDF would be easy to scoop and quite soft at -18°C.
|
Table 3. Determining the total FPDF of an ice cream mix containing several added sweeteners. |
||||
|
Sweetener |
Weight, g |
FPDF |
Total FPDF of sweetener |
Relative sweetness |
|
Sucrose |
8 |
1 |
8 |
8 |
|
Dextrose |
8 |
1.9 |
15.2 |
6.4 |
|
Glucose Syrup 62 DE |
2 |
0.8 |
1.6 |
1 |
|
Total FPDF or relative sweetness of mix |
24.8 |
15.4 |
||
Ice cream stored -18°C made with mixes with FPDFs ranging from around 20-25 will give easy to scoop ice cream. Similar ice cream stored at this temperature and made from mixes with FPDFs of <15 will be quite hard.
Relating FDPF values to hardness
It is relatively easy to produce a table listing FPDF values against recommended serving temperatures. As a general guideline gelato and ice cream producers should formulate mixes with FDPF values that give around 65 to 70% frozen water at the intended serving temperature. This can be done simply, either by trials or determining the freezing curve for the gelato mix and establishing the temperature which the mix is 65 to 70% frozen.
Regretfully accurate information on the precise relationship between FPDF is not readily available outside of companies some of which consider the the information to be commercially sensitive.
Application of the Potere Anti Congelante (PAC) method to control the hardness of ice cream
Lactose depresses the freezing point of water in a similar way to sucrose but is generally not included in FTDF calculations in the UK and North America. In continental Europe PAC is widely used to characterise ice cream mixes.
Examples of PAC calculations are given in examples 5, 6 and 7.
In example 5 a simple mix containing 10% MSNF is considered however the ingredients required to obtain these solids have not been defined.
|
Example 5. Calculate the PAC of an ice cream mix given the percentage values of major constituents Given: a mix containing (w/w) 10% MSNF, 8% fat, 12% sucrose and 0.3% emulsifier/stabiliser. Lactose constitutes 54.5% of MSNF (Van Slyke and Bosworth, 1915). The fat and the emulsifier/stabiliser have minimal effect on the FPDF and are not considered. Calculate the sugars present in 100 g of mix. The lactose present in the MSNF* is calculated. lactose = 0.545 x 10. Lactose constitutes about 54.5% w/w of MSNF (Van Slyke and Bosworth, (1915). = 5.45 g Sucrose=12g The PAC of each sugar is next calculated. PAC from lactose=5.45* x 1 =5.45 The PAC from sucrose=12 x 1 =12 The PAC of the mix is 12 + 5.45 =17.45 This will give a hard ice cream at -18 °C. |
The calculations described in example 6 are a little more complicated since several sweeteners are used. This is a fairly typical Italian Gelato recipe designed to make gelato for serving at around -11°C. The gelato will be relatively easy to scoop at this temperature.
|
Example 6. Calculate the PAC of an ice cream mix containing several added sweeteners Given: a mix containing (w/w) 8% fat, 14% sucrose, 2% dextrose, 2% invert sugar, 10% skim milk powder (SMP), 0.3% emulsifier/stabiliser and 36.6 % total solids. Lactose constitutes 54.5% of MSNF (Van Slyke and Bosworth, 1915). SMP contains 97% MSNF. The fat and the emulsifier/stabiliser have minimal effect on the FPDF and are not considered. The sugars present in 100 g of mix are calculated starting with the lactose present in the SMP*. Lactose = 10 x 0.97 x 0.545 = 5.29g Sucrose= 14g Invert sugar= 2 The PAC of each sugar is calculated. PAC from lactose= 5.29* x 1 = 5.29 The PAC from sucrose=14 x 1 = 14 The PAC from invert sugar=2 x 1.9 = 3.8 The PAC from dextrose=2 x 1.9 The PAC of the mix is 5.29 + 14 + 3.8 +3.8 =26.9 |
Cream is frequently used in ice cream and gelato manufacture. The higher the fat concentration the lower the concentration of MSNF and the lower the quantity of lactose supplied.
How the MSNF in cream is calculated and the lactose contributed by cream to ice cream mixes determined is discussed in example 7. It should be apparent that the quantity of lactose contributed by cream in this example is too small to have any significant influence on the freezing properties of the ice cream mix although it would be included in PAC calculations.
|
Example 7. How is the PAC from the lactose in cream added to an ice cream mix calculated? Calculate the PAC from the lactose contributed by the addition of 10% cream of 35% fat to an ice cream mix. Given: MSNF = (100 – (fat content of cream)) x 0.09 () and that 54.5% of the MSNF is lactose (https://www.dairyscience.info/forum/what-is-msnf-in-cream_topic134.html). Determine the MSNF supplied by the cream. 100-(35) x 0.09 x 0.1 =0.59 g Determine the lactose in the MSNF =0.59 x 0.545 =0.32 PAC =0.32 x 1 = 0.32 |
Are there advantages in using the Potere Anti Congelante method of calculating freezing point depression factor?
Yes, there are several advantages.
Most gelato manufacturers have good information on the relationship between PAC values and serving temperature and this information is relatively easy to obtain.
The PAC method should be used when batches of ice cream of significantly variable lactose concentration are being produced e.g. when ingredients containing high concentrations of lactose are used or mixes give softer than expected ice cream. Note, either of the methods described in this article will help manufacturers achieve the production of ice cream of consistent hardness.
Again manufacturers require a table showing PAC values that give ice cream or gelato of ideal hardness at particular temperatures.
I cannot emphasise enough how useful it is for anyone seriously interested in product development of ice cream or gelato to be able to construct a freezing curve for their mix.
How to reformulate ice cream mixes to obtain desired hardness characteristics
It is usually straightforward to reformulate mixes to obtain ice cream of the required hardness (note relative sweetness must also be considered!) providing the ice cream maker can provide a table showing the percentage ingredients on a weight-per-weight basis. Replacing sucrose with a mixture of fructose or inert sugar and glucose or high DE glucose syrups can easily be used to produce a range of mixes with defined hardness characteristics. The addition of relatively small quantities of glycerol or ethanol (e.g. from whiskey, rum and various spirits) can also be used to significantly lower the FPD.
The following examples, Examples 8 and 9, are intended to further illustrate how mixes can be reformulated to produce ice cream or gelato of defined FPDF or PAC values.
|
Example 8. Reformulate an ice cream mix to obtain a FPDF of 25 while maintaining a relative sweetness of 13. Given: A mix containing 8% fat, 13% sucrose, 0.3% emulsifier/stabiliser and 11.0% MSNF. Sweeteners available: sucrose, glucose and invert sugar. From table 1, sucrose has a FPDF of 1, glucose = 1.9 and invert sugar = 1.9. Sucrose has a RS of 1, glucose a RS of 0.8 and invert sugar a value of 1.3 This mix has a FPDF of 13 (13 x 1) and a relative sweetness of 13 (13 x 1) and will need to be adjusted so that the FPDF is increased (FP lowered) while maintaining the RS value. This is achieved by reducing the sucrose and replacing it with glucose and fructose. More glucose than fructose will be required because the glucose is less sweet than the other sweeteners. The weights of each sweetener are summed so that the combined values of relative sweetness and FPDF meet the target values required. It is very easy to set up a simple Excel spreadsheet and solve problems like this in a few seconds automatically using Solver. However, these very simple calculations can be done manually. The solution is 2.3 g of sucrose, 9.7g of glucose and 2.3g of fructose. The RS = 2.3 x 1 + 9.7 x 0.8 + 2.3 x 1.4 =13 The FPDF = 2.3 x 1 + 9.7 x 1.9 + 2.3 x 1.9 = 25 |
|
Example 9. Reformulate an ice cream mix to obtain a POD of 27 while maintaining a DOP of 17. Given: A mix containing 8% fat,16% sucrose, 0.3% emulsifier/stabiliser and 11.0% MSNF. Sweeteners available: sucrose, Glucose Syrup 42 DE and invert sugar. From table 1, lactose has a FPDF of 1, sucrose has a FPDF of 1, Glucose Syrup 42 DE = 0.8 and invert sugar= 1.9. Lactose has a RS of 0.16, sucrose has a RS of 1, Glucose Syrup 42 DE a RS of 0.5 and invert sugar a value of 1.3. This mix has a FPDF of 22 [(16 x 1) + (11 x 0.545 x 1)] and a DOP of 17 [(16 x 1) + (11 x 0.545 x 0.16)] and will need to be adjusted so that the FPDF is increased (FP lowered) while maintaining the DOP value. As in the previous example part of the sucrose will be replaced with other sweeteners (glucose syrup and invert sugar). Since the MSNF value is being maintained the original lactose concentration, 6g, (11 x 0.545) will remain constant. The solution is 6.5 g of sucrose, 6.2g of glucose syrup and 5g of invert sugar. The DOP =6 x 0.16 + 6.5 x 1 + 6.2 x 0.5 + 5 x 1.3 =17 The FPDF = 6 x 1+ 6.5 x 1 + 6.2 x 0.8 + 5 x 1.9 = 27 |
Further FPDF examples have been provided by Hull, (2010). Spreadsheets for calculating the relative sweetness and RFPD of ice cream mixes can be downloaded from this site.
Calculation of the initial freezing point depression of an ice cream or gelato mix and how to construct a freezing curve
More information on this important topic, examples of freezing curves and spreadsheets for calculating curves refer to the article on freezing point curves.
Acknowledgements
This article, and the article on the relative sweetness of ice cream, would not have been written without the prompting of Mr Lee Williams of Valenti’s Gelato-Artisan.
Lee Williams, an artisanal gelato manufacturer and consultant based in Cornwall, had studied gelato manufacture in Italy and had seen the benefits of the Potere Dolcificante (POD) and Potere Anti Congelante (PAC) methods in gelato manufacture. He contacted me to discuss how these continental methods could be used in the UK and Ireland. I hope that these articles will be of benefit to students and artisanal ice cream and gelato makers.
Have you found this article useful?
If yes, consider visiting an advert or making a small donation to the website. This will prevent articles like this from only being available through a paid subscription or on payment for a downloadable E-book.
Literature cited
Dempsey, P. G., McGorry, R. R., Cotnam, J. and Braun, T. W. (2000). Ergonomics investigation of retail ice cream operations. Appl. Ergon., 31(2):121—130.
Ebbing, Darrell D. (1990). General Chemistry, 3rd ed, Houghton Mifflin.
Goff, H. D. and Hartel, R. W. (2013). Ice Cream. 7th Edn. Springer: New York.
Hull, P. (2010). Glucose Syrups: Technology and Applications. Wiley-Blackwell: Chichester, U.K.
Iversen, E.K. 1983. Scoopable ice cream. N. Eur. Dairy J. 49(5): 116-122.
Jaskula, F.J., Smith, D.E. and Larntz, K. (1993) Comparison of the predictive ability of ice cream freezing point depression equations. Milchwissenschaft.50, 26-30.
Jiménez-Flores, R., Klipfel, N. J. and Tobias, J. (2006). Ice Cream and Frozen Desserts. In “Dairy Science and Technology Handbook. Product Manufacturing”. Volume 2. (Ed: Y. H. Hui). John Wiley & Sons: Hoboken, New Jersey.
Keeney, P. G., and M. Kroger. (1974). Frozen dairy products. In B. H. Webb, A. H. Johnson, and J. A. Alford (eds.), Fundamentals of Dairy Chemistry. AVI, Westport, CT.
Leighton, A. (1927). On the calculation of the freezing point of ice cream mixes and of quantities of ice separated during the freezing process. J. Dairy. Sci., 10, 300-308.
Marshall, R. T., Goff, H. D. and Hartel, R. W. (2003). Ice Cream. 6th Edn. Kluwer Academic: New York.
Smith, K.E. and Bradley, R.L. (1983). Effects of freezing point of carbohydrates commonly used in frozen desserts. J Dairy Science. 66, 2464-2467.
Van Slyke, L. L. and A. W. Bosworth (1915). Condition of casein and salts in milk. J. Biol. Chem., 20(2) 435-152.
How to cite this article
Mullan, W.M.A. (2013).
[On-line]. Available from: https://www.dairyscience.info/index.php/ice-cream/228-ice-cream-hardness.html?tmpl=component&print=1&layout=default&page= . Accessed: 18 April, 2024.
First posted 13 May 2013. Modified: February 2014; August 2015; January 2017; January 2018; April 2018.